About Us
Website’s 3 lists are now only UPDATED MONTHLY, since 2018.
Our primary recommendation- BUY & HOLD: Quarterly invest Equal-Weight in 20 stocks with Growing Dividends.
More specifically – Every 3 mos., after our updates for the months of Feb/May/Aug/Nov invest equal amounts in each of the stocks in our “20 ticker/company PORTFOLIO”, which we’ve selected from our then-current Complete BUY LIST (of approx. 100+ stocks).
The author of this site is a Certified Public Accountant in public practice for approximately 50+ years. In 2011 he decided to formally "examine" the "investment approach" that had produced exceptionally successful results for his pension plan, and for clients with whom he had shared it.
The UNEXPECTED INSIGHT gained from his examination was that for the 27 companies for which there was a 30 year history the dividend yield on the Original Cost now ranged from 5.36% to 266.06%. More remarkably now, 30 years later, 11 of the companies were ANNUALLY PAYING a dividend (cash into the bank every year) of MORE THAN 100% of the Original Cost!! (The tickers for those 11 companies were: ABT, ADP, BMS, CTL, INTC, ITW, JNJ, KO, MCD, MKC, PEP.)
The "investment approach": invest in companies that have a history of increasing their dividend, and that also every 10 or 15 years have had a "stock split") -and, to ensure diversification, the Rule: if investing $5,000, then invest $1,000 in 5 different companies; if investing $12,000, then invest $1,000 in 12 different companies; if investing more than $20,000, then invest 1/20th (5 %) in 20 different companies.
The examination initially took the form of a spreadsheet of 41 stocks in
which he was invested. The spreadsheet examined performance in terms of
both current dividend % yield on the Original Cost and current % gain or loss on the Original Cost over three periods: 30 years, 20 years, and 10 years.
See hulbertratings.com links to the audited, independent substantiation of our performance compared to The Prudent Speculator (a dividend oriented advisory site with an outstanding 40-year 14.13% average annual return), as well as other sites which hulbertratings.com audits.
FROM THE INFORMATION PRESENTED BELOW you can clearly calculate, from the author’s 237 [= 41+196] companies sample (which is approximately 10% of the 2000+ dividend paying stocks) that 135, or 57% [=(27+108)/237], of the dividend paying companies had been paying dividends for 30+ years, and, of those 135 companies in the sample, there were 35, or 26% [=(11+24)/135], that after 30 years were annually paying dividends of more than 100% of the split-adjusted costs per share.
TWO FACTORS caused the author to not be aware that now, 30 years later, he was receiving annual dividends of more than 100% of the Original Cost per share. The two factors were:
1) The effect of "stock splits" on his Original Cost basis per share currently held;
2) The fact that as dividends had increased, the price of the shares had increased, resulting in the "then-current dividend % yield on the then-current price per share" always reflecting a "normal range" for stocks in general.
(For the other 16 companies with a 30 year history, the current dividend % yield on Original Cost was: 3 companies were paying a dividend yielding less than 20% (Tickers: KMB, WMK, YORW); 10 companies were paying a dividend yielding 21% to 50% (Tickers: AGL, BMY, COP, CVX, EMR, GPC, MMM, NFG, NST, PPG); 3 companies were paying a dividend yielding 51% to 100% Tickers: CPB, LLY, PG).)
Over the next two years, 2011 and 2012, the author of this website, on a hypothetical basis, added to his spreadsheet 196 more dividend paying companies, which came to his attention through various "business media" TV programs. Of those 196 companies, 108 had a 30 year history. From these additional 108 companies, now, 30 years later, 24 of the 108 added companies were now ANNUALLY PAYING a dividend (cash into the bank) of MORE THAN 100% of the Original Cost!!
[In case you’re inclined to think what you’ve just read about DIVIDEND YIELDS of the “… 27 companies …” is “too good to be true”, here is an example of the “median” performing company, LLY (Eli Lilly and Company):
In Summary: One share purchased at $62.00 on 5/11/1981, became 16 shares over the next thirty years without any other purchases being made, therefore the cost for each of those 16 shares was $62 divided by16 = $3.875 per share. Thirty years later each of those shares was receiving, as of 5/11/2011, a dividend of $1.96 which was effectively an annual return of 50.58% on the original cost of $3.875 allocated to each share. Each share at 5/11/2011, was worth $38.28 representing a price appreciation of 887.87 % over its $3.875 cost, and over the 30 years each share had received cumulative total dividends of $26.17, which represents an additional 675.35 % return, received in the form of dividends, on its $3.875 cost.
Here are the details:
Thirty-plus years ago on 5/11/1981 LLY closed at $62.00 and its Annualized Dividend at that date was $2.30, representing a yield of 3.71 %.
At 1/30/1986 LLY split 2 for 1;
at 5/1/1989 LLY split 2 for 1;
at 12/21/1995 LLY split 2 for 1;
and at 10/16/1997 LLY split (you guessed it!) 2 for 1.
Consequently, after the last split I held/owned 16 shares in place of each share I had originally purchased. Therefore my cost basis per share had changed from $62.00, to 1/16th that amount, or $3.875 per share.
Thirty years later on 5/11/2011 LLY’s Annualized Dividend was $1.96, representing a yield on “split-adjusted” original cost of 50.58 %. LLY’s closing price at 5/11/2011 was $38.28 representing a price appreciation of 887.87 % on the “split-adjusted” original cost. This price appreciation is in addition to 675.35 % return received in the form of dividends (i.e., the $26.17 of dividends, per share, received over the thirty years) on the “split-adjusted” original cost.
(UPDATE: At the date of this writing, 11/25/2016, 5+ years later, LLY’s insufficient dividend growth over the past five years, AND dividend payout ratio in excess of 75 % for the past two years, has resulted in LLY no longer appearing on this site’s “HOLD, don’t sell List” – however, not being on the “HOLD, don’t sell List” simply means we don’t recommend any current accumulation of LLY.
LLY’s closing price at 11/25/2016 was $69.12 and LLY’s Annualized Dividend at 11/25/2016, if it continues to pay a dividend, is $2.04, which would equal a current yield of 2.95 % of its closing price on 11/25/2016.)]
BUY AND HOLD works for this site's "investment approach": invest in companies that have a history of increasing their dividend, and that also every 10 or 15 years have had a "stock split".
To check the 30+ year historical data (and performance) for any ticker on this “About Us” page:
Test this approach with LLY, which is the detailed example presented above. To keep these instructions easily, and immediately, available for reference, open a new tab in your browser and copy/paste this link to yahoo finance into it https://finance.yahoo.com/ > after the page fully loads, input a ticker in the “Search” area, hit “ENTER” > again, give the data at least a full minute to fully load > to the right of the line where you see “Summary” click “Historical Data” > after the data fully loads, on the right-side of “Time Period” click the “down-arrow” > insert “Start Date” 5/11/1981 and “End Date” 5/11/1981 > click “Done” > then click the blue “Apply” button > among the data presented you will see “Close* ” where “ * “ means “Close price adjusted for splits.”
To see the 5/11/1981 historical data for another ticker, type the ticker in the “Search” area, hit “ENTER” > then (as long as the “Historical Data” “Time Period” still shows the “May 11, 1981” dates) click the blue “Apply” button.
Also, a stock chart of Annual Dividends is much easier to "relate to" for "actionable" information:
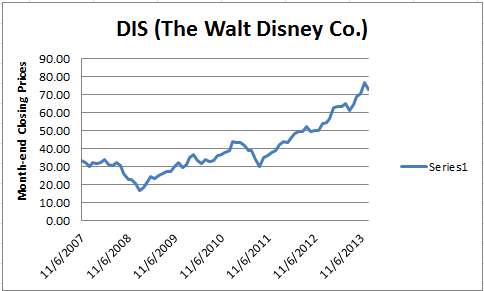
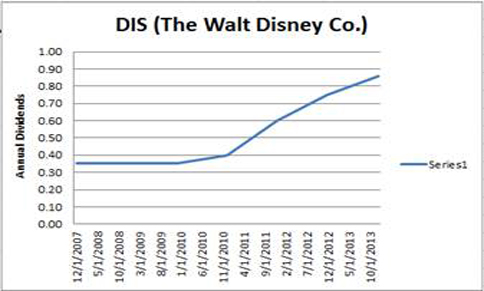
Hence, the "mantra" inserted throughout this site: INVESTING so STOCK PRICE MOVEMENT is IRRELEVANT when deciding when to SELL.