Click-by-Click: How to perform our screens manually:
BUY AND HOLD works for this site's "investment approach": invest in companies that have a history of increasing their dividend (not necessarily every year) , and that also every 10 or 15 years have had a "stock split".
Also, the chart of Annual Dividends is much easier to "relate to" for "actionable" information:
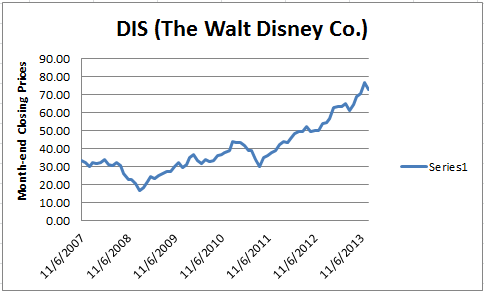
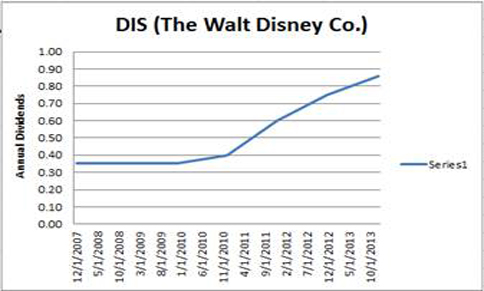
Hence, the "mantra" inserted throughout this site: INVESTING so STOCK PRICE MOVEMENT is IRRELEVANT when deciding when to SELL.
For your first attempt at using the following manual instructions for "How to ID what to invest in", input DIS (the stock symbol for The Walt Disney Company) to see if that company still qualifies as "a DIVIDEND GROWTH COMPANY in which you can invest", as it did when the preceding paragraph and image above it were created.
How to ID what to invest in -- and a couple of important "tips" if you do invest in stocks!
INVESTING so STOCK PRICE MOVEMENT is IRRELEVANT when deciding when to SELL.
1. With your internet browser open Yahoo.com and click on Finance (or use this link: http://finance.yahoo.com/ ).
VERY IMPORTANT UPDATE:
The following instructions for manually duplicating our screening using finance.Yahoo.com haven’t been updated to reflect the specifics of using finance.Yahoo.com since its revision in early 2016. Although all the data necessary is still available on finance.Yahoo.com, the specific approach to accessing that data has become more complex, and the response time is somewhat slower than it used to be. THEREFORE, THE INSTRUCTIONS THAT FOLLOW SHOULD BE USED IN THE SEQUENCE THAT IS SUGGESTED, TO ACCESS, and evaluate as indicated, EACH TYPE OF DATA IDENTIFIED; however, the click-by-click information is no longer accurate.
2. In the "Search Finance" input area either type in the company's stock Symbol or its name.
3. When the company you are researching appears in the drop down search results list, click on it.
a. LOOK FOR COMPANIES WITH POSITIVE EARNINGS: If the "EPS (ttm)" is a positive amount continue to the next step, 3. b., -- OTHERWISE, STOP AND START OVER INVESTIGATING ANOTHER COMPANY.
b. LOOK FOR COMPANIES WITH DIVIDENDS: If the "Div & Yield" shows an annual "Div"idend amount, and next to it in parenthesis a "Yield"% continue to the next step, 3. c., -- OTHERWISE, STOP AND START OVER INVESTIGATING ANOTHER COMPANY.
c. MAKE CERTAIN THE "% Dividend Payout" IS REASONABLE: Now calculate the "dividend payout" as a % by dividing the "Div" amount by the "EPS (ttm)" amount (i.e., Div/EPS (ttm)), then convert this ratio to a % by moving the decimal point two places to the right. If the "% dividend payout" is less than 75.0% (i.e., a smaller ratio than .7500, for example .2800, which converts to 28.0%) then continue to the next step -- OTHERWISE, STOP AND START OVER INVESTIGATING ANOTHER COMPANY.
4. CHECK THE COMPANY'S RECENT DIVIDEND HISTORY: In the list of links find "Historical Prices" and click on it.
5. Change the "Set Date Range" "Start Date" to a year at least eight years earlier than the current year and click Apply.
6. Then move the "bullet" point to the right of the dates from "Daily" to "Dividends Only" by clicking on "Dividends Only".
7. Then click on "Get Prices".
8. LOOK FOR UPWARD TRENDS IN DIVIDEND PAYOUT: You should see that the three most recent full calendar years reflect at least one dividend payment in each of those years.
9. If the test in the previous step is met then continue to the next step -- OTHERWISE, STOP AND START OVER INVESTIGATING ANOTHER COMPANY.
10. THE DIVIDEND HISTORY SHOULD BE EVALUATED IN TERMS OF THE TOTAL DIVIDEND(S) PAID EACH YEAR: At a minimum there should have been at least one dividend increase in one of the past 3 years -- and no decreases in that first 3 year period, unless it was related to a stock split. [Note1: Sometimes companies will pay a large one-time special dividend, then revert back to the normal dividend payment pattern. Don't count such an occurrence as a "dividend decrease".] [Note2: If you see there have been splits (AND SPLITS WHERE THE FIRST NUMBER IS BIGGER THAN THE SECOND NUMBER ARE A GOOD THING!!) then x:y means that at the indicated date the record of shares held by an existing stockholder was adjusted to show x for each y share(s) previously held (and proportionately on that date there was an equivalent adjustment to the share price and the dividend, so effectively there was no immediate change in the value of what the shareholder owned).]
11. If the test in the previous step is met then continue to the next step -- OTHERWISE, STOP AND START OVER INVESTIGATING ANOTHER COMPANY.
12. MAKE CERTAIN THAT THE "Dividend Growth Rate" IS SUFFICIENT TO JUSTIFY THE COMPANY BEING CALLED A Dividend Growth Company: SKIP THIS STEP UNLESS the dividend history shows dividends were paid for at least the last 6 years. If dividends were paid for the last 6 years then the TOTAL DIVIDENDS PAID FOR the most recent FULL- year should be at least 1.4 times the TOTAL DIVIDENDS PAID FOR the FULL-sixth year back.
13. If the test in the previous step is met, OR QUALIFIES TO BE SKIPPED, then continue to the next step -- OTHERWISE, STOP AND START OVER INVESTIGATING ANOTHER COMPANY.
~~AT THIS POINT YOU HAVE THE EQUIVALENT OF OUR "HOLD" LIST (Primary Screen) RESULTS, a listing of stocks that are okay to “Hold”, because they haven’t met any of our “no longer accumulate" criteria. (Note: Our HOLD List (Primary Screen) criteria also exclude all: Over-the-Counter, ADR/ADS, REIT, Limited Partnership, as well as Non-optionable stocks and stocks with fewer than three analysts following them.)
ADDITIONALLY, STOCKS THAT MEET THE FOLLOWING STEPS 14. AND 15. ARE THE EQUIVALENT OF OUR “BUY” LIST (Secondary Screen).
14. In the list of links down the left side find "Balance Sheet" and click on it.
15. MAKE CERTAIN THAT THE COMPANY'S "Balance Sheet" and "Income Statement" ARE GROWING STRONGER: Make certain in the window that appears under the title "Balance Sheet" that the "View" shows "Annual Data" as black(or selected); then scroll all the way to the bottom of the columns with numbers and make certain, reading from right to left (i.e. the oldest dated column to the most current dated column), that the "Net Tangible Assets" amount has been "improving" (at a minimum the left, most recent amount, should be greater than the right, oldest amount) -- "improving" means that if the amounts are negative (i.e. bracketed) then the negative amounts have got smaller, or have turned positive.
If "Net Tangible Assets" isn't shown/identified, you can manually calculate it as follows: +add:Total Assets -subtract:Goodwill -subtract:Intangible Assets -subtract:Other long-term assets (if your investigation of this category indicates it is unclear that it represents any realizable value, if a "restructuring", or bankruptcy, required it to be sold) -subtract:Total Liabilities =equals: "Net Tangible Assets". If "Net Tangible Assets" is negative then every share has that potential final value from any financial crisis resulting in a "restructuring". For example: in the 2008 financial crisis all the General Motors common stockholders lost everything, as part of the government's "restructuring". Subsequently, new common stock was issued to acquire funds to partially repay the government - and those are the General Motors shares currently being traded on the stock exchange. However, all the General Motors common stock that was in existence before the 2008 "restructuring" ceased to have any value and became worthless.
~~Next – In the list of links down the left side find "Income Statement” and click on it.
MAKE CERTAIN THAT THE COMPANY'S "Income Statement" IS GROWING STRONGER: Make certain in the window that appears under the title "Income Statement" that the "View" shows "Annual Data" as black(or selected); then scroll all the way to the bottom of the columns with numbers and make certain, reading from right to left (i.e. the oldest dated column to the most current dated column), that the annual "Net Income Applicable To Common Shares" amount has been "improving" – and none of the three amounts should be negative (i.e. bracketed).
16. If the test in the previous step is met then continue to the next step -- OTHERWISE, STOP AND START OVER INVESTIGATING ANOTHER COMPANY.
17. Congratulations!! INVESTING so STOCK PRICE MOVEMENT is IRRELEVANT when deciding when to SELL. You have found a DIVIDEND GROWTH COMPANY in which you can invest.
All the rules you need to manage your do-it-yourself portfolio selections from our site are concisely presented at manage_your_do_it_yourself_portfolio.
Back to Top